

Introduction
The Modbus Monitor Advanced is an Android app that communicates using the Modbus protocol through various interfaces. You can download the Modbus Monitor Advanced from the Google Play Store or the official download page. This app allows you to poll Modbus-speaking devices for data directly from your mobile device.
The Modbus Monitor Advanced operates in two modes: Master and Slave. The operation, configuration, and communication differ based on the selected mode. Just so you know, not all features discussed here apply to the free version of the Modbus Monitor app. The paid version, Modbus Monitor Advanced, includes all features of the free app and excels in pro features, configuration options, and ease of data input.
In Master (Client) mode, the app polls remote devices to retrieve data, which is then displayed in the chosen data format, including raw data. In Slave (Server) mode, your phone or tablet acts as a Modbus TCP Slave Device, allowing other devices on the network to poll your device for data. The advantage of the Modbus Monitor Advanced is that it combines both modes in one application, eliminating the need to purchase separate apps.
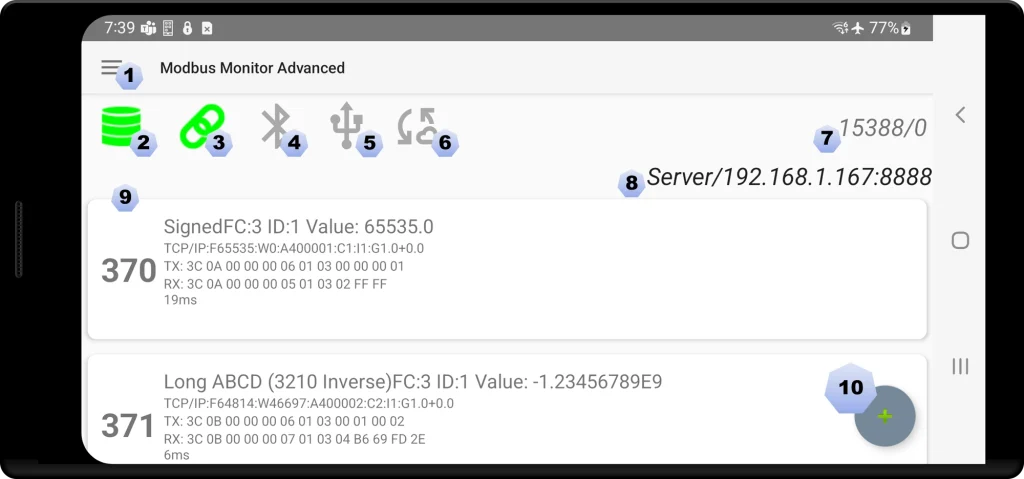
The Modbus Monitor Advanced features a simple user interface. Most commands are accessible through single or long taps on the Monitor Point Entry. The diagram below explains the meaning of each item on the mobile screen.
Main Window
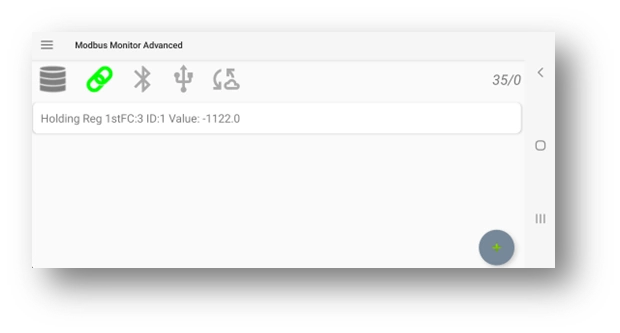
The main window of the Modbus Monitor Advanced app is designed for ease of use and functionality. At the top header, the status bar displays the Hamburger Menu button [1] and the Application Title. Below this, the main interface includes rows of quick access buttons that combine status indicators and action buttons such as toggle start/stop. These include Server Mode Status/Start/Stop [2], Client Mode Status/Start/Stop [3], Bluetooth Status/Start/Stop, USB Ports Status/Available Port, and IoT Status/Start/Stop. Additional information includes Good and Bad packet counters [7], and details on the Server IP Address and Port when running in server mode. Each Modbus Monitoring Point is displayed per row, showing Name, Configuration, and Modbus return Value, send and receive frame, and packet response time [9]. There is also a button to quickly add a new Monitoring Point with default settings [10].
Quick Start Example:
1. Press the + Button to add a new Monitor Point with default settings.
2. Click the Monitor Point and select “Change” to set up the Monitor Point. Click TCP/IP (Channel), set the IP Address and Port from a remote server, and specify the Number of Registers, and the Protocol (Modbus TCP is the default).
3. Click the Link Icon to start polling the remote server and view the value.
Main Menu
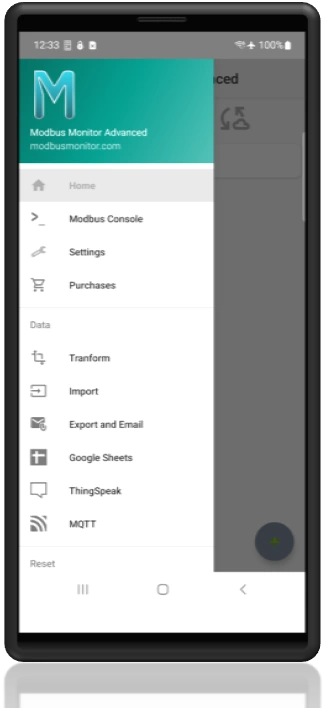
- Home: Home Location (Press the back button to close Menu)
- Modbus Console: Run Modbus Client Console similar to Modbus Monitor (Free) App
- Settings: Configuration screen for Modbus Master, Server, Timing, Bluetooth, Sleep, Logs, Google Sheets, ThingSpeak, and MQTT.
- Purchases: Purchase Add-On
- Transform: Transform old Modbus Map into a latest version for compatibility.
- Import: Import Modbus Monitor CSV Points file from Downloads folder.
- Export and Email: Export Data and Device Configuration via email attachment. Add your own email to get data in CSV format for easy editing in the Excel.
- Google Sheets: Settings related to Google Sheets Add-on (when purchased)
- ThingSpeaks: Setup ThingSpeak to periodically send data.
- MQTT: Setup MQTT client.
- Factory Reset: Erase all monitoring point and default app settings.
- Reset T/RX Counts: Reset TX/RX counter.
- Reset Statistics: Reset the Min/Ave/Max statistics value for each monitor point.
Monitor Points
The Modbus Monitor Advanced goes beyond polling single Modbus Address and Function Code to poll remote servers. It enhances Modbus Address with additional information that builds a powerful list of what is called Monitor Points. We will describe what each Monitoring Point holds later in the section. For now, we will describe how to manage each Monitoring Point (item) from the full list.
The full list of Monitoring Points can be built by adding new items one at a time or importing thousands of items from a CSV file from email or the mobile device’s Download folder.
Click on the Monitoring Point Item to open the Monitor Points Management dialog box.
Monitor Points Management Menu

- Communications: Start or stop the Modbus Client. This is the same as clicking on the Link Icon. This is also the default action when no item is selected and OK is clicked.
- Add: Add a new Monitoring Point with default settings. This is the same as clicking the + floating button.
- Remove: Remove the selected item.
- Change: Change or edit the selected Monitoring Point. This option is usually used after a new item is added to configure or set up the Monitoring Point.
- Copy: Copy the selected item to memory.
- Paste: Paste the copied item from memory and add it as a new item.
- Write: Write and send a new value to Modbus. Modbus Write must be enabled for each item for this to work (Write is disabled by default to prevent accidents).
- Write Preset Value: Write the preset value to the Modbus Server. The preset value is set previously when setting up a new Monitoring Point.
- Hide/Unhide Configuration: Show or hide the line below the Register Name that displays a short description of the configuration.
About Modbus Monitor Point
A Monitoring Point is similar to tags in a PLC and holds all information relevant to defining Modbus, the communication medium, display, and preset writing values. The table below shows the description of items or metadata inside each Monitoring Point that can be configured. With Modbus Monitor Advanced, each monitor point can be set up with a different physical interface, Modbus protocol, IP Addresses, and more.
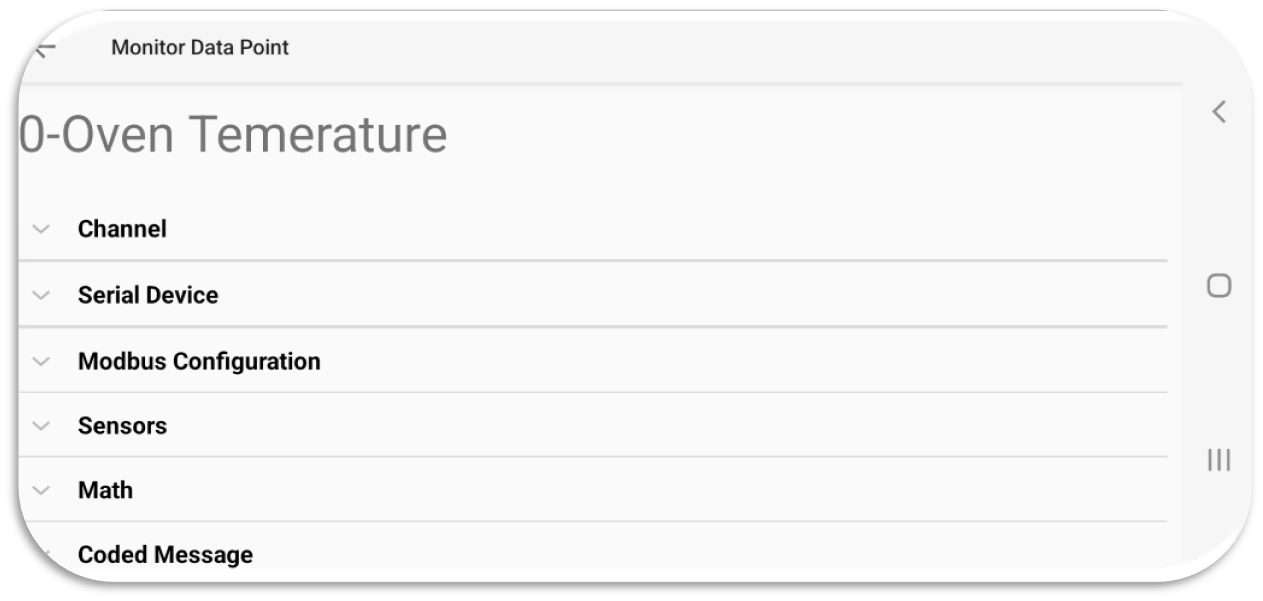
Modbus Point (tags) Configuration
Channel Settings: Modbus Communication Interface and protocol settings (click to expand)
| Channel | Description |
|---|---|
| TCP/IP | Use Ethernet or Wi-Fi for Modbus communication and configure the settings and protocol to match the remote server. IP Address: Server’s IP Address Port: Remote Server’s Port Protocol: Modbus TCP, Modbus RTU over TCP, Modbus UDP, or Modbus RTU over UDP |
| Serial Port | Send Modbus over Serial Port connected to USB via USB-OTG connector USB Port: Click to select COM Port connected (and approved) Interface: Default or alternate interface (Hardware specific) Baud Rate, Databit, Parity, Stopbit, Flow Control (self-explanatory) Protocol: Choose Serial RTU or ASCII |
| Bluetooth BR/EDR/LE | Send Modbus over Bluetooth BR, EDR or Bluetooth LE interface Device: Click to select the Bluetooth Address from the list |
Modbus Configuration: Modbus configuration and display settings (click to expand)
| Modbus Tag | Description |
|---|---|
| Name | Name to describe this Monitor Point (ex. Oven Temperature) |
| Units | Suffix to add after value (ex. °C) |
| Address | Six-Digit Modbus address that includes Function Code. Example: Read 1st Holding Register: 400001 (Function 3) Read 1st Input Register: 300001 (Function 4) Read 1st Coil: 000001 (Function 1) Read 1st Discrete Input: 100001 (Function 2) |
| Enron | Choose Yes to use Enron address and protocol layer. |
| SlaveID | Server or Slave ID of the remote Modbus server |
| Count | Number of registers to request. Default is 1 but varies based on the Data Type field below. Number of register and Data Type (below) works together to display data in correct format. |
| Data Type | One of INT16, INT16U, HEX, BINARY, INT32, FLOAT32, DOUBLE64, STRING, BCD, EPOCH, INT32U, INT64, INT64U |
| Write Function | Function to use for Write Operation: Read Only (Default), 05 Write Single Coil, 06 Write Single Register, 15 Write Multiple Coils, 16 Write Multiple Registers, or Auto (choose based on the Function type and number of registers) |
| Swap | Choose from byte swap and/or word swap options |
| Button Write Value | The preset value will be used for the “Write preset value” option in the Modbus Point Management dialog box. |
Sensor Server: Settings related to Sensor Server Mode (click to see expand)
| Sensor | Description |
|---|---|
| Sensors | Select internal sensor to use in Modbus Client or Modbus Server (Sensor Server Mode) |
Math: Linear transformation and scaling settings (click to expand)
| Sensor | Description |
|---|---|
| Math | Linear transformation: Linear translation equation y = mx+b >Gain: Enter value for Gain or slope in the linear equation (m) >Offset: Enter value for Offset as “Offset” in the linear equation (b) Linear Scaling: Linear Scaling converts values from one range (e.g., PLC values) to another (e.g., real-world units). >Analog K1: Lowest value the PLC Analog module produces (i.e 0 for 0mA) >Analog K2: Highest value the Analog module produces (i.e. 65535 for 20mA) >Low Limit: Low limit of real-world unit (i.e. 0 watts) >High Limit: High Limit of real-world unit (i.e. 1000 watts) |
Coded Message: Translate numbers to predefined strings (click to expand)
| Sensor | Description |
|---|---|
| Coded Message | Translate the Number value to a predefined string (ex. 1=”Normal” 2=”Off”, etc.) >Long Click on “None” (when the list is empty) to see an additional option. The configuration menu shows Add, Change, Move UP, Move Down, and Remove. Click Add and follow the prompts. |
Modbus Client Mode (Modbus Master)
The Modbus Monitor Advanced app operates in two modes: Master (Client) and Slave (Server). This section explains the Client (Master) Mode, while the Server (Slave) Mode is detailed on the Modbus Slave page. In Master Mode, the app polls the remote device using a specific protocol and displays the returned values.
To start polling in Master Mode, Modbus Monitor Advanced requires at least one monitor point. You can add a monitor point by clicking the (+) button or selecting “Add” from the menu. When you click “Add” or (+), a monitor point is added with default settings and values. Tap the Monitor Point in the list and select “Change” to edit it. Refer to the About Monitor Point for detailed explanations of these options.
One of the first options is the “Channel.” In this option, you choose the physical or network device your remote device (server/slave) will use for communication. The Modbus Monitor Advanced supports two physical layers: Ethernet/Wi-Fi TCP/IP and USB Serial Port(s).
- If your remote device is connected via Wi-Fi or Ethernet, choose “TCP/IP” as the Channel.
- If your remote device is connected to your phone or tablet via a USB Serial port, select “Serial”
- If you want to connect to your remote Server using Bluetooth, choose Bluetooth
Depending on the selected option, Modbus Monitor Advanced adjusts the editing dialog box to display the appropriate input fields (e.g., “Baud rate” for serial channels or IP Address for “TCP/IP” mode). These input fields are explained in the About Monitor Point section.
The following important field is the Protocols option menu. Only specific protocols are compatible with the selected “Channel.” The table below helps you choose the correct combination:
- Modbus TCP protocol is supported in the “TCP/IP” channel and works as both Modbus Master and Modbus Slave/Server.
- Serial ASCII and RTU protocols are only supported on the Serial or Bluetooth Channels.
Modbus Monitor Advanced skips the monitor point if the wrong combinations of protocols and channels are set. If you happen to encounter communication errors, please make sure the correct Channel and Protocol are set for each monitor point.
With Modbus Monitor Advanced, you can set different protocols, IP Addresses, Ports, and Channels for each monitor point entry. This advanced SCADA-level data collection approach provides a single interface for setting and viewing live values from various operation modes.
After programming the Slave ID for your remote device, set the correct Modbus Address. This address is in the Modbus Protocol format, not the more common PLC address scheme. The full 16-bit protocol range (0 to 65535) is supported, but address translation may be needed from the more commonly used PLC format. Visit the Modbus Address page for more information.
The Count field can be any value less than 125 words per Modbus Protocol Specification. The most common value is 1 (register), but it varies depending on the data type represented by the remote device. For example, a floating value takes two words. Visit the Data Type page for more information. Ensure the correct number of counts is programmed to display the data type.
Click the “Link” icon to start polling from remote servers. The data value is shown in the monitor point list if all settings are correct. If question marks (“???”) are displayed, Modbus Monitor Advanced cannot collect data from remote servers.
Selecting the “Write” option from the Modbus Point Management dialog box (tap on the Modbus monitor point) allows you to write values to the remote servers. See the Write Page for more information about this dialog box.
Modbus Write Dialog
The Write Dialog box is displayed when selecting the “Write” option. The dialog box on the left appears when Write is selected in the Modbus Monitor Management Dialog. The header shows the name of the Monitor Point along with the Data Type. Enter the value in the write Field and click the Change button.

Note that the Write Dialog box is available in Master and Server modes. During the Master operation, the write value is included in the Modbus packet sent to the remote server (using the selected Write Function). During Modbus Slave operation, the write value is stored in internal registers, and the remote master waits for it to poll those registers. Once polled, the write value is retrieved from internal memory and included in the Modbus packet sent to the remote Modbus Master.
Quick Start Guide: Modbus Client (Master)
The Modbus Monitor Advanced app has two modes of operation: Master Mode (Client) and Slave (Server) Mode. This section explains the Modbus Master Mode. For details on the Modbus Slave mode, refer to the Modbus Slave page. In Master Mode, the app polls the remote device using a specific protocol and displays the returned values.
To start polling in Master Mode, Modbus Monitor Advanced requires at least one monitor point. You can add a monitor point by clicking (+) or selecting “Add” from the menu. When you click “Add” or (+), the monitor point is added with default settings and values. Tap on the monitor point in the list and select the “Change” option to edit the newly added point. Refer to the Parameter Page for detailed explanations of all options. One of the first options is the “Channel.” In the Channel option, you choose the physical or network device your remote device (server/slave) will use for communication. Modbus Monitor Advanced supports three physical layers: Ethernet/Wi-Fi TCP/IP, Bluetooth, and USB Serial Port(s). More details on the configuration can be Channel Settings on this page.
If your remote device is connected to Wi-Fi or Ethernet, choose “TCP/IP” as the Channel. If your remote device is connected to your phone or tablet via a USB Serial port (USB-OTG), choose the “Serial” channel. Most quality USB serial port manufacturers list the internal chipset on their website. Depending on the selected option, Modbus Monitor Advanced switches the option that matches the channel selected. (e.g., “Baud rate” for serial channels or IP Address for “TCP/IP” mode). The fields are explained in the About Monitoring Point section on this page.
The next important field is the Protocols option menu. Only certain protocols are compatible with the selected “Channel.” The table below may help you choose the correct combination. For example, the Modbus TCP protocol is supported in the “TCP/IP” channel and works as both Modbus Master and Modbus Slave/Server. Data and formats will be applied in Master or Server mode. The table also shows that “Serial ASCII” and “Serial RTU” protocols are only supported on the serial channel. Modbus Monitor Advanced skips the Modbus Monitor Point if incorrect combinations of protocols and channels are set. If your communication shows errors, ensure the correct Channel and Protocol are set for each Modbus Monitor Point.
With Modbus Monitor Advanced, you can set different protocols, IP addresses, ports, and channels for each Monitor Point Entry. This advanced SCADA-level data collection approach allows you to set and view live values from various operation modes through a single interface.
After programming the Slave ID for your remote device, you must set the correct 6-digit Modbus Address. See the Address option in the Modbus Configuration section above for examples of the 6-digit scheme that combines Modbus Address and Function Code in a single address (no need to enter enter function code separately). The 6-digit scheme supports the full Modbus Protocol Address range (0 to 65535) instead of just 1-9999 registers only.
The Count field can be any value less than 125 words per Modbus Protocol Specification. The most common value set for the count is 1 (register). However, the value varies depending on the data type represented by the remote device. For example, a Float value takes two words. Visit the Data Type page for more information. Ensure you program the correct number of counts for the type of data to be displayed.
Click on the “Link” icon to start polling from remote servers. If all settings are correct, the data value is shown in the monitor point list. If question marks “?????” are displayed, Modbus Monitor Advanced is unable to collect data from remote servers.
Writing values to remote servers is possible by selecting the “Write” option from the Modbus Point Management dialog box (tap on the Modbus monitor point). Refer to the Write Page for more information about this dialog box.
Modbus Server Mode (Modbus Slave)
Modbus Server Mode and Sensor Server is discussed on the Server Page.