

Introduction
The Modbus Monitor XPF application is a versatile tool for facilitating communication between a Windows-based Personal Computer and Modbus Client or Server devices. It can be downloaded from the Microsoft Store or Download Page. This application offers a trial version, allowing users to explore its features before committing to a full license.
One of the standout features of Modbus Monitor XPF is its dual functionality, encompassing both a Modbus Client and a Modbus Server within a single application. This dual capability, combined with support for both Modbus Serial and Modbus TCP protocols, makes it an invaluable tool for various Modbus communication needs.
In this guide, we will walk you through the essential operations of the Modbus Monitor XPF application, providing you with the foundational knowledge needed to get started. You are also welcome to check the YouTube channel for short demonstrations of the features. Additionally, we will delve into some advanced scripting commands for those who have purchased the full license to help you maximize the application’s potential.
Getting Started
Learn how to install and setup Modbus Monitor XPF Application and configure it for your specific needs:
- Installation
Modbus Monitor XFP application can be installed either directly from our web-site’s purchase or shop page or from Microsoft Store built into Microsoft Windows. The application runs in Windows 10 or newer with a minimum of 4GB RAM: Install from the Web – Visit QuantumBitSolutions.com | Download or Shop pages to download or purchase the application. The software is a portable version, meaning it can be run from any location without requiring installation. Note that during the first launch, a slight delay is normal as the application unpacks files to a temporary location.
 Install via Microsoft Store – Search for Modbus Monitor XPF directly in the Microsoft Store on your Windows Desktop. Once installed, the application can be accessed from the Start Menu. You may optionally click this link to direct the Microsoft Store Link to download or web URL to our product.
- Download & Purchase: Additional location to purchase the license or download the Modbus Monitor XPF application.
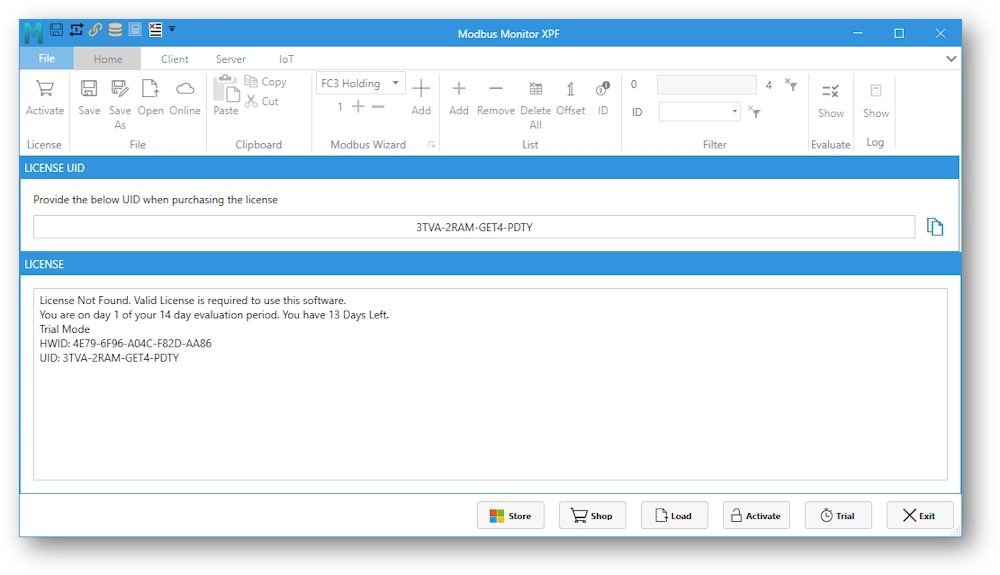
- Activating the Licensing of the Software: This guide will walk you through the steps to activate the license for your Modbus Monitor XPF software. Below is an explanation of the buttons and fields available on the licensing screen to help you navigate the activation process. Main steps to Activate the Software:
- Purchase License: Click the “Store” or “Shop” button to visit the licensing store and complete your purchase. License purchased via Microsoft Store can be activated by Clicking the Store button. License purchased
- Microsoft Window’s Store: Click Store button to purchase and (same button) the activate license.
- Online purchased Key: Click Activate button and enter license key purchased online.
- Load or Enter Key: A site license or offline license can be activated by loading a special license file. After purchasing a license, you can load the license file using the “Load” button to manually enter your license key.
- Verify Activation: Once activated, the License Information Panel will confirm your activation status, and trial mode will be disabled.
| Section | Description |
|---|---|
| License UID Section | Field: This is where your unique User Identification (UID) is displayed. You will need this UID when purchasing the license. Copy Button: Click this button to copy the UID to your clipboard, making it easy to paste into a purchase form or email. |
| License Information Panel | Displays the current status of your license. If no valid license is found, this panel will show: Trial mode details, including how many days are left in your evaluation period. Hardware ID (HWID) and or UID (User ID) required for activation. |
| Licensing Buttons | Here are the main buttons you’ll use: Activate: After purchasing a license, click this button to activate the software. You’ll be prompted to input your license key. Load: If you already have a offline license file saved on your computer, use this button to load the file into the software. Trial: Click this button to begin or continue using the software in trial mode, if you haven’t activated a license yet. Store: Opens the Microsoft Store, where you can purchase a valid license for the software. This button can also be used to activate the purchased license on a new computer. Shop: Takes you to the online Shop page to purchase license key or add-ons Exit: Closes the licensing screen and exits the application. |
Navigating the Application
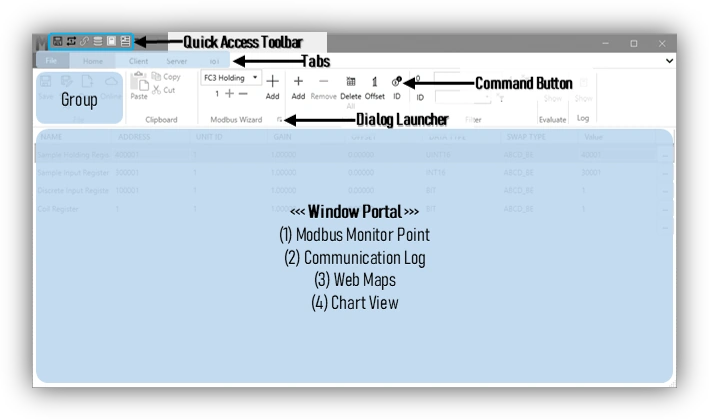
Modbus Monitor XPF – Application Window
The main application window of the Modbus Monitor XPF application is organized into several key sections:
- Quick Access Toolbar: Located at the top, this toolbar includes icons for common actions like ‘Save’, ‘Undo’, and ‘Redo’.
- Tabs: Below the toolbar, there are multiple tabs such as ‘File’, ‘Home’, and ‘Client’. The active tab is highlighted.
- Command Buttons: In the middle section, there are buttons labeled ‘Add Device,’ ‘Delete Device,’ and ‘Offset ID,’ among others. These buttons are accompanied by arrows indicating their functions.
- Dialog Launcher: A small button in the corner of the command section, used to open additional settings or options.
- Window Portal Area: The bottom section displays different information depending on the selected mode. By default, the Monitor Point list is displayed. When the Log button is toggled, the Log window appears. Similarly, the Web File navigation window is shown when the Online button is toggled. Each area provides relevant information for the tasks being performed.
Application Window – Ribbon Tabs
The standard Modbus Monitor XPF ribbon contains the following tabs, from left to right:
- File – Allows you to jump into the backstage view containing essential file-related commands and application theme settings, license information, file explorer, and links to online resources.
- Home – Contains the most frequently used commands such as copying and pasting, Modbus Wizard, list management, etc.
- Client—This contains the commands related to Modbus Client (Master), such as Modbus Interface, Timeout, Write Function Codes, Scanner, Chart, Poll Controls, etc.
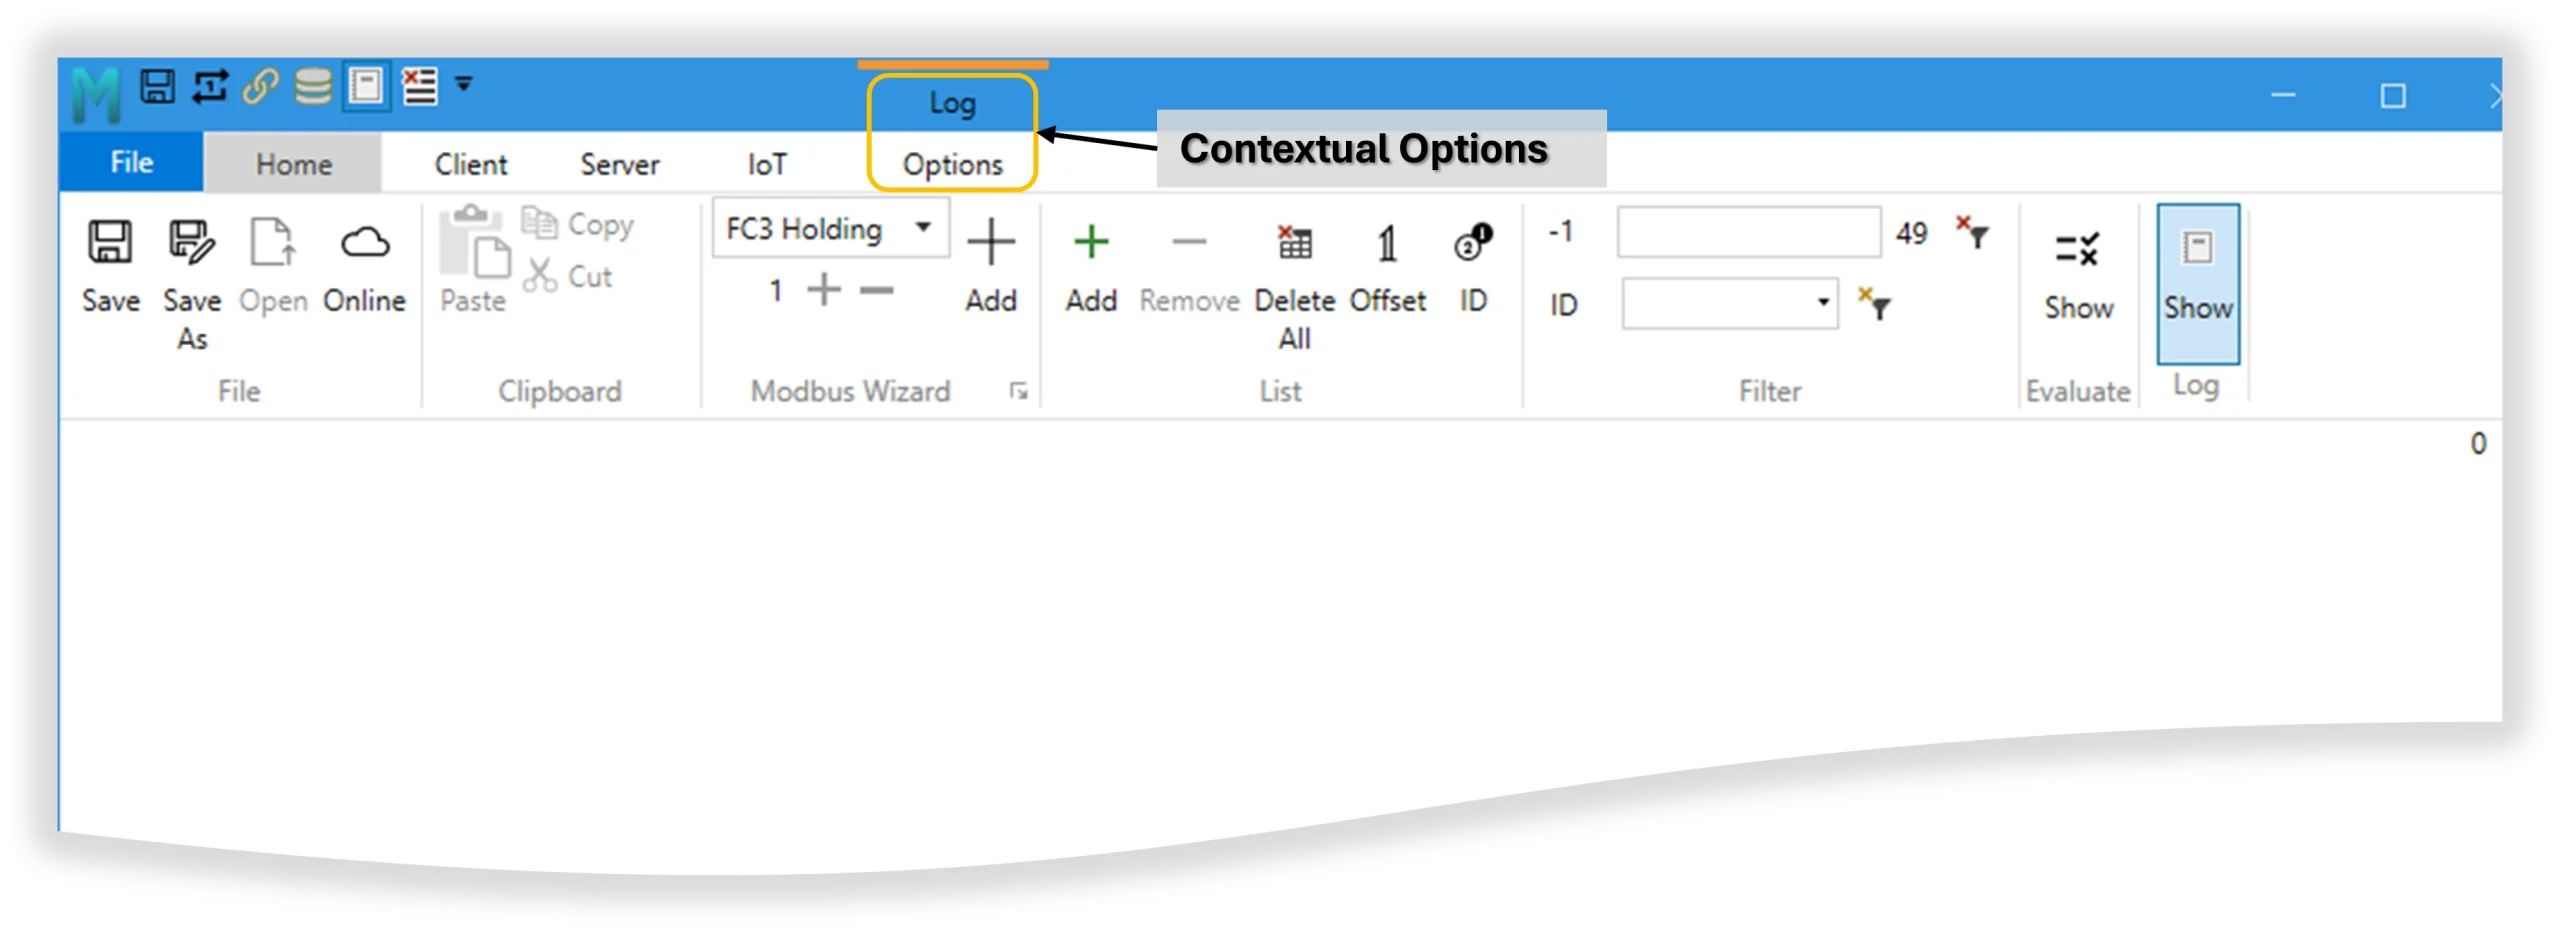
- Contextual Ribbon tabs – In addition to the constant tabs described above, the Modbus Monitor XPF ribbon has context-sensitive tabs, also known as Option Tabs. These tabs appear only when you select a specific item, such as a Log. For example, if you choose the Log option from the Quick Access or Home Tab, the Log – Option tab will appear.
File Tab
| Home | Home: Click to navigate to the Documents Folder Open: Open the folder in the Windows Explorer Up: Move Up one level in the directory tree <Documents>: Displays the name of the current folder |
| Recent | Shows the list of files that were recently loaded. Refresh: Refreshes the recent file list Open Folder: Opens the folder containing the selected file in Windows Explorer. Open File: Loads the selected file in Modbus Monitor XPF. Remove: Remove the selected file from the Recent list. Delete: Deletes all recently used files from the list. |
| About | About Option Features: Version: Displays the current version of the Modbus Monitor XPF application you are using. Activate: You can activate an online-purchased license during the trial period. Click and enter the license key from the purchase email. Submit Feedback: Provides an option to submit feedback about the application directly to the developers. Documentation: Access the online help file for detailed information and guidance on using the application. Videos: Links to online YouTube videos for tutorials and demonstrations related to the application. Contact E-mail: Provides the contact email address for support or inquiries. Privacy Policy: Displays the privacy policy outlining how your data is handled and protected. EULA (End User License Agreement): Shows the terms and conditions for using the software. |
| Settings | Select a theme: Light, Dark, or System Default |
| Exit | Exit the application |
Home
| File | Save: Save the current document in CSV format Open: Open previously saved file Online: Download Modbus Maps from an online folder or community. For further explanation, refer to the image below. |
| Clipboard | Paste: Paste from the clipboard from the selected row(s) either from the application or Microsoft Excel. Add them to the end of the list. Copy: Copy the Selected Single or Multiple Row(s) to Clipboard. Multiple sequential rows can be selected with Shift-Click’s first and last row. Multiple rows can be selected using the Control-Click in any order. Cut: Copy the Content of the current item to the clipboard and delete the item from the list. |
| Modbus Wizard | The Modbus Wizard simplifies adding a new monitor point by allowing you to do it directly through the GUI. This means you don’t have to manually edit the configuration, making it more user-friendly and efficient. For further explanation, refer to the image below. |
| List | Add (+): Used to add new Monitor Points to a list. It uses the last row and increments the Modbus Address by one for easy entry. Remove (-): Remove the single or multiple selected items from a list. Delete All (x): Removes all Monitoring Points. Offset (1): 1 for one-based addresses or 0 for zero-based addresses in the Address field ID: Change Unit ID for all Monitoring point to the new value |
| Filter | Selected Row Index: The first number shows the index of the currently selected row or monitor point. This is especially handy when the list is filtered and you want to know the true index of the selected row. Text Entry: Enter the key value that you want to filter the list by. All Name Fields containing the text will show up as a filtered list. Total Rows: The total number of rows or points in the Monitor Points List. Clear Filter: Clears the filter and shows all rows. ID: Select the Unit ID or Slave ID to filter the list. |
| Evaluate | Change the background colors of the Value cell based on the High, Low, and Nominal Limits. Quickly validate the value from the Modbus device and test to see if it is within the valid range. Please take a look at the full description below. |
| Log | Please take a look at the full description below. The log can be turned on during the application when specified with a configuration or project file. This button stays on during Log Monitoring. Click again to turn off the Communication Traffic Monitoring view portal (but the communication traffic still monitors if it started already). Activating Logging: You can enable logging using a configuration or project file or by clicking the start button in the contextual options. Once enabled, logging remains active during Log Monitoring. Log Monitoring Button: When you click this button, it stays on to indicate that Log Monitoring is active Deactivating the View: Click the button again to close the Communication Traffic Monitoring view portal. Hints: > If the file or project is saved, traffic monitoring will automatically start the next time the project is loaded. > Communication traffic monitoring will continue if it has already begun, even though the communication traffic view is showing or not. |
Online
View and Download Online Modbus Maps from either (1) released by Modbus Monitor or (2) uploaded by users of the online community. Toggle the Online button in the File group located in the Home tab to activate this feature. An internet connection is required to use this feature.
| X | Back | Close this Online Map navigator and go back to the previous view |
| 1 | Maps from Factory | Officially released and validated Modbus Maps |
| 2 | Community Maps | Click to see maps shared by others |
| 3 | Share | Upload your Modbus Map and share with the online community |
| 4 | Download | Download Online Maps |
| 5 | Status | Download or Upload status. Green Check mark: All went OK Red Cross: Check: Error downloading. Download process interrupted or check the Internet connection. |
| 6 | Name | Name of the map just downloaded |
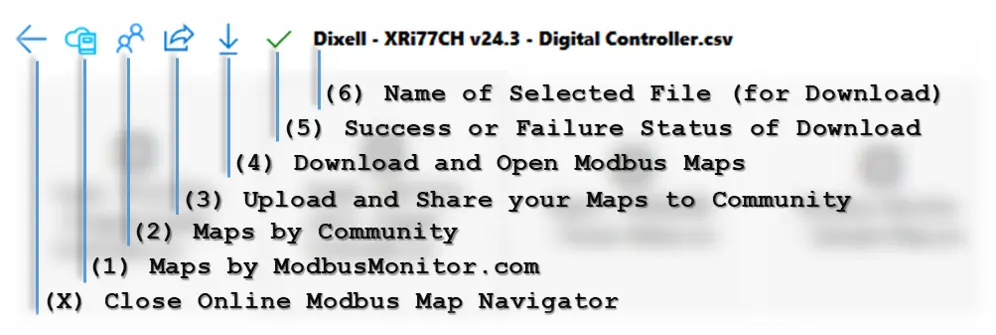
To Download Files:
- Click on the Factory Icon [1] and wait for the list to update from the cloud.
- Click on the File Name from the list of available devices; the file name appears in the text area [6]
- Click on the Download button [4]
- The Modbus Map of the devices automatically opens when the file successfully opens after the green check mark [5] appears and the online button closes.
To Upload File:
- Click on Community icon [2]
- Click on the Share Icon [3] and choose the local XPF Modbus Map data file
- Green Check shows [5] when the file is successfully uploaded.
- Click on the Community Files Maps icon [2] to refresh the list of files in the window.
Modbus Wizard
The Modbus Wizard can add a new monitor point on an empty row. This allows for easy configuration of the monitor point using the GUI instead of manually editing the configuration.
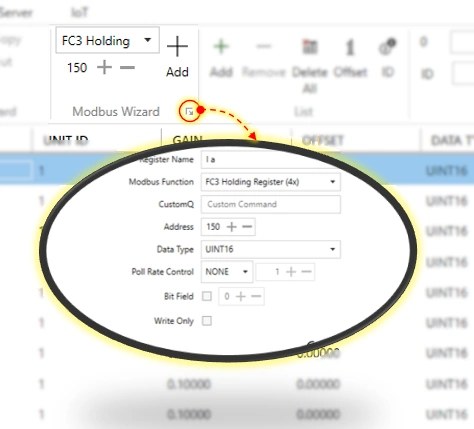
- Dialog Box Launcher: Click to see more options related to the Modbus Wizard.
- View: Click on the row and view the existing configuration.
- Edit: Click on the row and use the combo box to change the Modbus Function, Modbus Address, Data Type, Magic Codes, etc. The Modbus Monitor XPF ensures that the proper unique Magic Codes are added.
- Add: Add a new monitor point by selecting a well-known Modbus Function Type.
List
Manage Monitor Points (also called Row or Item)
- Add (+): New Monitor Point with Default Values
- Remove (-): Selected Monitor Point from Monitor Point List Table
- Delete All : Delete All monitoring points from the Monitor Point List Table
- Offset: Set One Based mode. Set Offset to 1 or 0 for the Modbus Address listed in the Address Column. In other words, address values in the list start with 1 (1-65536) or 0 (0-65535)
- ID: Change ID for all monitoring points.
Filter
Search Name and Address fields to filter the monitoring points based on the search criteria entered in the Filter box.
- Left Number: Shows the row number of the currently selected row.
- Filter Box: Filters the list match the value in the Name or Address columns.
- Right Number: Shows the total number of monitoring points in the full or filtered list.
- ID Box: Select Server ID (Station ID or Slave ID) to filter the list further.
Evaluate (Validate or Test)
Change the background colors of the Value cell based on the High, Low, and Nominal Limits. Quickly validate the value from the Modbus device and test to see if it is within the valid range.
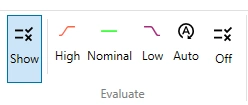
- Show: Click to extend the toolbar with more options.
- High: Filter the list to show values that have reached the High Limit.
- Nominal: Show monitoring points with Nominal Values.
- Low: Filter the list to show values that have reached the Low Limit.
- Auto: Automatically update the UI with selected filters after each scan.
- Off: Toggle Evaluate (Test) Mode on or off for all monitoring points.
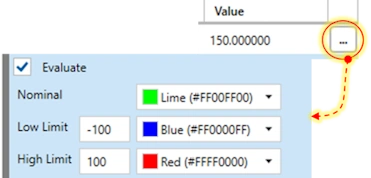
- Show: Click on the three ellipses at the end of the row to see extended information on the Monitoring Point.
- Evaluate: Checkmark to turn the feature on or off.
- Nominal: Choose a color for the Nominal Value range. The nominal range is calculated between the Low Limit and High Limit.
- Low Limit: Choose a color to highlight the Value column when the value equals or exceeds the Low Limit. The value can be numerical or string type.
- High Limit: Choose a color to highlight the Value column when the value equals or exceeds the High Limit. The value can be numerical or string type.
- String: Set the same High and Low Limit for String Data Type.
Events and Communication Log
Switch to the Events Log Window to view Modbus communications and general events. The Monitoring Points area is switched to show event logs in the same area. Use the “Log” button to switch between both views.
- Log Button: Switches between Event Log view and Monitoring Point view (shown with arrows in the picture).
- The Log button is located in the Home tab or Ribbon Header.
- The Events log consumes more processing power and memory to log data at a high rate. Therefore, turn off this feature when not needed.
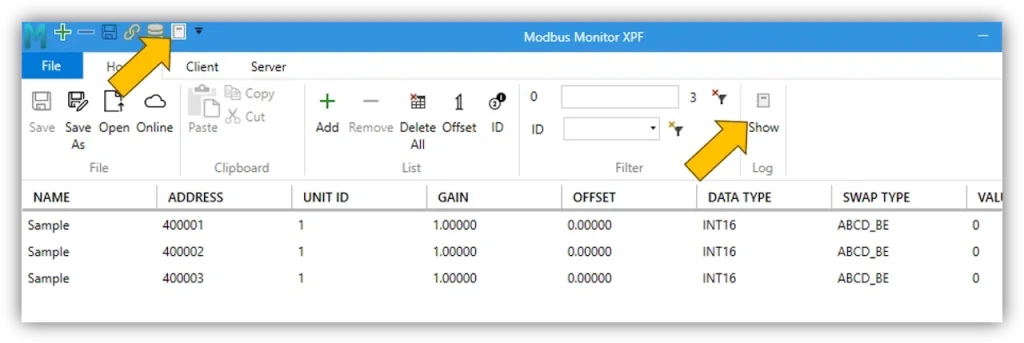
- Click on the Show Log button to show the Log Window.
- Start/Stop Button: Click Start to Start the communication logging in comma delimited text
- Clear: Clear all logs
- Save As: Save displayed log to text file
- Errors: Show only communication events with Errors
- Scroll: Scroll to the latest communication log.
- The events in the windows are time-stamped with UTC.
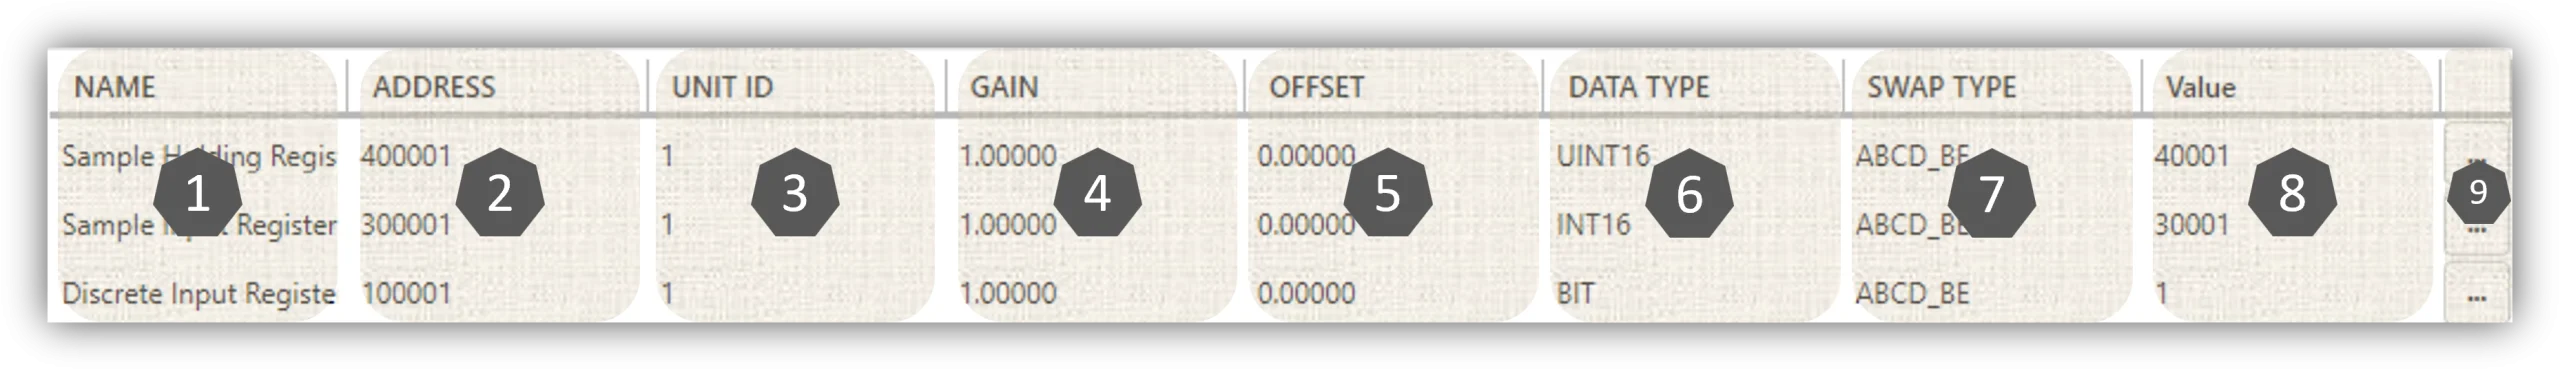
Monitor Points – Fields (Columns)
Each Monitor Point (row) provides detailed information beyond the essential Modbus Register, Function Code, and Slave ID, enhancing the Modbus experience. The table below provides a brief description, with more detailed information available in the Monitor Point – Detailed Description Section.
| # | Field | Description | Format | Example |
|---|---|---|---|---|
| 1 | Name | Name of the Monitoring Point. It may contain Magic codes to enhance polling. Please take a look at the detailed description below. | String | Unit Name:16 |
| 2 | Address | Modbus Address in 6-digit format. Disabled and value is ignored when CustomQ (Custom Commands) are used. | Integer | 400001 |
| 3 | Unit ID | Station ID or Modbus Slave ID for this Monitor Point | Byte | 1 |
| 4 | Gain | Gain or “m” in Linear transformation (Y=mX+b) | Float | 1.5 |
| 5 | Offset | Offset or “b” in Linear transformation (Y=mX+b) | Float | 100 |
| 6 | Data Type | Convert and show the value obtained from the remote server after polling the Modbus Monitor point. | Enum | INT16 |
| 7 | Swap Type | Byte and Word swap options when two or more registers are polled. | Enum | ABCD_BE |
| 8 | Value | Displays read the value from the remote server or edits and update the value to write to a remote server (when Write mode is not Disabled. | String | Solar Meter 123 |
| 9 | Extended Options | Additional options beyond basic Modbus Polling and Writing are available to enhance the Modbus experience, including Custom commands (CustomQ), Charting, Evaluation, and Simulation capabilities. |
Monitor Point – Detailed Description
- Name Field
- Usage: The Name field contains a string value to name the monitoring point (row) for easy cross-reference. It can be used with or without unique tags (Magic Key Codes). The field must not contain a comma “,”.
- Example: “Water Temperature” or “Water Temperature:16” (Polls 16 continuous Modbus registers, which can later be converted to a string using the “STRING” Data Type below).
- Extra Magic Key Code: Extra Magic Key Codes can be added to enhance polling and processing, such as Bit Field, Write Only Point, Poll Rate, etc. The Modbus Wizard automatically adds these codes, making it easy so you don’t have to remember them.
- Modbus Wizard Convenience: The graphical form in the Modbus Wizard adds these codes automatically, making it easy to forget them. (Details on using the Modbus Wizard are below.)
- String Length
- Description: Read Modbus string that is spread across many Modbus registers.
- Format: “:xx”
- Usage: Add the Colon symbol followed by the number of continuous registers.
- Example: “:16”
- Poll Update Rate
- Description: Poll Rate for each Monitor Point can be controlled by adding a special symbol. In other words, the Poll Update Rate specifies the interval at which the Modbus register is polled on every scan.
- Format: “@xxxx”
- Usage: Add “@” symbol followed by the numeric value in milliseconds
- Example: Model Name@1000 (poll at 1000 milliseconds)
- Special Values:
- “@-1” Poll Once the Start button is pushed
- “@0” Always skip monitor points during polling
- Bit Fields
- Description: The 16-bit register value can be used as Bit
- Format: “.n”
- Usage: Add the “Period or dot symbol” symbol followed by the index bit number from 0 to 15. .
- Example: “.8” Grab Bit 8 from 16-bit Modbus register value.
- Date Time: Display Modbus registers as Date/Time Format
- Description: Display the value as Date Time, fetch the number of registers, and convert them to standard Date/Time formats.
- Format: DOS | EPOCH | EPOCHMS | DT2 | DT3 | DT4 | DT4P | DT6 + DATETIME Data Type
- Usage: Add one Special Magic Code from above to from these possibilities and change the Data Type from INT16 to “DATETIME” for this code to work. See DATETIME Data Type (below) for more information.
- Example: (1) “DT6” added to Name Field and (2) Data Type = “DATETIME”
- Multiple Magic Codes: Combining multiple Magic Codes allows for further refinement of the polling action.
- Example: To get the string value spanning 32 registers only once after polling is started, add “
@-1:31” to the Name Field. - Explanation: The Name Field contains two Magic codes. One for Poll Rate [1] and the other for String Length [2]. So, the system will poll once [1] at the start with a string length [2] of 32 registers (64 bytes or characters) by combining the String Length and Poll Update Rate options.
- Example: To get the string value spanning 32 registers only once after polling is started, add “
- Usage: The Name field contains a string value to name the monitoring point (row) for easy cross-reference. It can be used with or without unique tags (Magic Key Codes). The field must not contain a comma “,”.
- Address Field
- Format: The address field uses a 6-digit address scheme combining function code and complete Modbus Address in a single value.
- Value Range: The first digit is Address Mode + 0 to 65535 (for 0 Base) or 1 to 65536 (for one Base)
- Address Mode:
- “0x” for Modbus Function 1 – Coils
- “1x” for Modbus Function 2 – Discrete Inputs
- “4x” for Modbus Function 3 – Holding Registers
- “3x” for Modbus Function 4 – Input Registers
- Other Modbus Functions – Value Ignored
- Address Mode:
- Base: Address is 0-based or 1-based depending on the “One Based” check-mark in the List Tab.
- Examples:
- Read 1st Holding Register: 400001 (One based checked, Function 3, Read/Write)
- Read 1st Holding Register: 400000 (One based unchecked, Function 3, Read/Write)
- Read 1st Input Register: 300001 (One based checked, Function 4, Read-Only)
- Read 1st Coil: 000001 (One based checked, 1st Register, Function 1)
- Read 1st Discrete Input: 100001 (One based checked, Function 2)
- Unit ID Field
- Unit ID or Station ID or Slave ID of the register for Master and Server
- Byte Value (1-247)
- Example: 1
- Gain Field: Scaling factor to multiply the incoming value from Modbus Frame.
- Offset Field: Factor to add or subtract after gain is applied.
- The Gain and Offset values are to be multiplied and Offset Added to the result obtained from the remote Server (Client Mode).
- For example, the Modbus Value field will calculate to 12350 when the gain is set to 10, and the Modbus Server sends a 1235 value.
- Server Mode: Gain and Offset will be applied before the value is sent to the remote Master. In other word
- Float Value Column = Gain x [Modbus Value Obtained] + Offset (Linear Formula)
- Example: 1.00 (default Gain, Multiple 1), 0.00 (Default, no Offset)
- Value to be multiplied and Offset Added to result obtained from the Server
- Server Mode: Gain and Offset will be applied before the value is sent to the remote Master.
- Data Type Field: ” Convert and show value obtained from remote server after polling the Modbus Monitor point.
- Display Format
- BIT Display as BIT
- INT16 Display as 16-bit Signed value
- UINT16 Display as 16-bit Unsigned value (Default)
- INT32 Display as Signed 32-bit value (Two Registers are automatically polled)
- UINT32 Display as Signed 32-bit value
- FLOAT32 Display as 32-bit Float
- INT64 Display as 64-bit Integer
- UNIT64 Display as 64-bit Unsigned Integer
- DOUBLE64 64-bit Double Float
- HEX Display as Hex format
- STRING Display as Text message
- DATETIME – Display as Date Time with Magic Code.
- To make this format work, you need to add a Magic code to the Name field. The processor uses the code (WIN, DT3, DT4, DT5, DT6) in the Name Field (column) to properly request the number of registers required for this display format to decode and display time properly.
- There is no Modbus standard when it comes to date time, so analyze the manufacturer’s documentation to determine the number of registers required to fetch date and time. Then, simply choose the correct Magic Code from below. Here are the codes:
- DOS: DOS Time Stamp Y1980, 2 Registers – [YYMMDD] [hhmmss]
- EPOCH: Unix Epoch, 2 Registers
- DT2: Same as DOS
- DT3: Date Time, 3 Registers – [YY|MM] [DD|hh] [mm|ss]
- DT4: Date Time, 4 Registers – [YY|MM] [DD|hh] [mm|ss] [ms]
- DT4P: Date Time Y2000 Modbus Plus, 4 Registers – [XX|YY] [MM|DD] [hh|mm] [ms]
- EPOCHMS: Unit Epoch in Milliseconds (4 Registers)
- DT6: Date Time, 6 Registers – [YYYY] [MMMM] [DDDD] [HHHH] [ MMMM] [SSSS]
- Use Swap Type (below) to match the remote device’s Byte Order
- For more information, please contact support.
- Display Format
- Swap Type Field
- Byte and Word Swap when multiple registers are polled based on the Data Type
- Swaps multiple Registers based on the selection:
- ABCD_BE: ABCD swap or Big-Endian (Default)
- CDBA_LE: CDBA swap or Little-Endian
- BADC_BEBS: BADC swap or Big-Endian Byte Swap
- CDAB_LEBS: CDAB swap or Little-Endian Word swap
- Value Field
- Red Border shows on error or special message from the scanner. Click on the cell (edit) to see the special message.
- Server Mode: Send Value as entered to Server based on the Data Type
- Modbus Master: Shows value polled from the remote device after applying Swap type, Gain/Offset, and Data Type
- Modbus Server: Value to send to the remote Master device. Click a cell to change send the new value to send to remote Master (All conversions are applied per settings before sending the new value)
- Extended Information
| CustomQ | Custom Command String Send custom commands in a two-character HEX format. Typically, this field contains only PDU bytes. It is populated when sending Modbus commands with other function codes specified in the Modbus Specification, such as the Get Event Log (Function Code 17). This feature allows for precise control and customization, ensuring your Modbus communication is tailored to your needs. |
| Chart | Charting Time-Series Values With our advanced charting capabilities, visualize Modbus values as dynamic time series data. Effortlessly track and analyze time-variant data, allowing you to monitor trends and patterns over specific periods. This feature transforms raw data into insightful visual representations, making it easier to understand and interpret the performance and behavior of your Modbus devices. |
| Evaluate | Evaluate and Test Modbus Values with Conditional Formatting Effortlessly test and evaluate Modbus values using our advanced conditional formatting feature. Colorize values based on specified ranges to easily identify and highlight data outside expected parameters (string) or range. This powerful tool serves as a validation mechanism and enhances regression testing by visually flagging anomalies and deviations. Transform your data analysis with intuitive and insightful visual cues. |
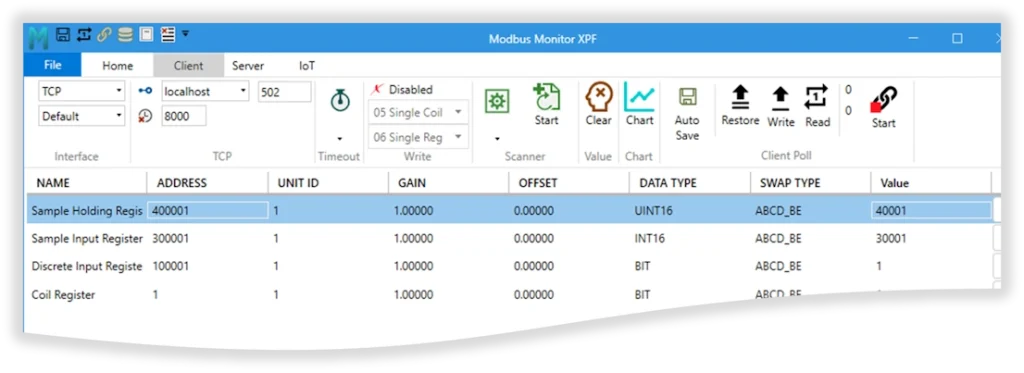
Modbus Client (Tab)
In Client mode, the Modbus Monitor XPF acts as a master device, continuously polling remote Modbus servers to retrieve data. This data is then displayed in a user-friendly format, making it easy to monitor and analyze. The application supports both Modbus Serial and Modbus TCP protocols, ensuring compatibility with a wide range of devices.
The Modbus Monitor XPF’s control panel provides options for configuring the polling rate, which determines how frequently the Modbus registers are polled. This flexibility allows users to tailor the polling frequency to their needs, ensuring timely and accurate data collection.
Overall, the Modbus Monitor XPF’s Client mode is a powerful feature that enhances the application’s functionality, making it an invaluable tool for anyone working with Modbus communication. Whether you’re monitoring industrial equipment, collecting data from remote sensors, or managing a complex network of devices, the Modbus Monitor XPF has you covered.
| Group | Description |
|---|---|
| Interface | Choose from three interface options: >TCP: Initiate a Modbus TCP client using an IPv4 or IPv6 address that supports IPv4 and IPv6 IP addresses or a hostname. >UDP: Initiate a Modbus UDP client with support for both IPv4 and IPv6 IP addresses or a hostname. > Serial: Start a Modbus RTU client via a serial COM port. There are eight possibilities: Modbus TCP: Interface = TCP, Protocol Options = Default Modbus RTU over TCP: Interface = TCP, Protocol Options = RTU Modbus ASCII over TCP: Interface = TCP, Protocol Options = ASCII Modbus UDP: Interface = UDP, Protocol Options = Default Modbus RTU over UDP: Interface = UDP, Protocol Options = RTU Modbus ASCII over UDP: Interface = UDP, Protocol Options = ASCII Modbus Serial RTU: Interface = Serial, Protocol Options = Default or RTU Modbus Serial ASCII: Interface = Serial, Protocol Options = ASCII |
| TCP or UDP | IP Address: Enter the remote Modbus client’s IP address in either IPv4 or IPv6 format. You can also use a string hostname, such as “localhost.” Modbus Port: Specify the TCP port number for the connection. Timeout: Set the connection timeout value in milliseconds. This determines how long the system waits before restarting a new TCP connection (socket). |
| Serial | Serial Interfaces Option COM: Choose the COM port to initiate communication with the remote serial server (Slave). Communication Parameters: Set the Baud Rate, Data Bits, Stop Bits, and Parity. |
| Timeout | Timeout – Modbus Packets Timing Response Timeout: The duration the system waits to gather all bytes from the remote server. This includes the time to receive the complete Modbus frame up to the CRC (Cyclic Redundancy Check) or to detect a short frame error. Example: Wait for 3000ms (3 seconds) to gather all bytes up to the CRC or to tag a short frame error. Inter-Frame Delay: The interval before sending the next frame or the wait time between each item in the list, measured in milliseconds. Example: Wait for 20ms before polling the next item in the list. Poll Rate is the delay before starting a full list scan or waiting time before polling the entire list again, measured in milliseconds. Example: Wait for 1000ms (1 second) before polling the entire list again. Hint: These settings are crucial for optimizing communication efficiency and ensuring reliable data transmission in Modbus networks. Adjusting these parameters can help manage network traffic and improve the overall performance of the Modbus communication system. |
| Write | Write – Modbus Write Function Codes Settings Disabled (Default): Don’t allow Modbus to write commands to a remote server. For any edits in the Value column, revert back to the new value read by the server during the next scan. (Read Only) Auto: Automatically select Single or Multiple Coil or Registers based on the Data Type selected. (Read/Write) Manual: Manually select function code for Write for Register(s) from 6 (0x06) or 16 (0x10) and code for Write for Coil(s) from 5 (0x05) or 15 (0x0F). |
| Scanner | Modbus Scanner: Efficiently poll remote servers to discover new Modbus addresses or build comprehensive Modbus maps for devices lacking public Modbus maps. |
| Value | Clear: Clears the data in the Value Columns when starting the poll and each scan. |
| Chart | Visualize the data values over time, making it easier to analyze trends and patterns. Switch to Chart View: Navigate to the Chart View window in the Modbus Monitor XPF application. Time Series Data: This view will display time series data. Charts: The chart data will be for values marked with the “Chart” option at each monitoring point. Please refer to the Chart Section below for a detailed explanation. Refer to the Charts – Data Trends section for a detailed explanation. |
| Client Poll | Auto Save Feature: Effortlessly Save Your Data; our Auto Save feature automatically saves every scan to a CSV file in your Document Folder. Filenames are generated seamlessly, and data is instantly added to the newly created file. This powerful feature enhances the Chart option, allowing you to export poll data from every monitoring point for post-analysis with tools like Excel or Matlab. Experience the convenience and efficiency of automated data management! Restore Feature: Effortlessly Configure and Validate Your Modbus Devices; This feature allows you to write monitoring data directly into the remote Modbus device. You can program the remote device with preset values or configurations from all monitoring points. This makes it an excellent tool for production environments, enabling you to configure and set up Modbus devices efficiently and validate their configurations. Write Once: Write the selected Monitor Point once and then stop. Read Once: This button reads all monitoring points once and then stops. Use it when one or more monitoring points need to be polled once and then stopped. Note: The Poll Start (chain link) does not need to be started to use the Read or Write Once buttons. |
| Start | Regularly polls the Modbus server based on the timers programmed in the timeout section. Updates IoT servers, chart, or local files when those features are enabled. |
Scanner – Settings
Poll remote server to discover new Modbus Addresses or build Modbus Map for devices without public Modbus Maps.
- Start – Start Address to start scanner in 6-digit format
- Regs – Number of registers or polls to serially scan
- Data – Assumed Data Type. The program automatically calculates the number of registers (1, 2, 4) to request depending on the Data Type selected
- Swap – Data Swap for 32 or 64-bit data values
- ID – Server ID to start scanning
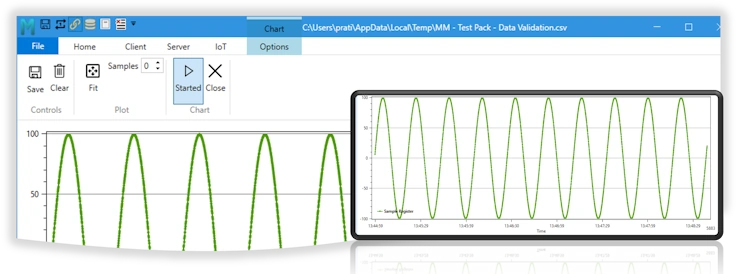
Charts – Data Trends
Modbus charting is essential for anyone working with industrial automation and control systems. With Modbus Monitor XPF, you can effortlessly visualize your Modbus data through time series, making it easier to analyze trends and patterns.
To see the trending data, the monitoring point must be tagged and included in the chart. Enabling the data and choosing an axis (either axis 0 or 1) in the Monitoring Point settings, accessible via the extended button, is as easy as clicking the extended button.

Click the Chart button to switch to the Chart Window. Notice the Chart Option context menu with chart-related controls:
- Save: Saves chart data as a CSV file in the user document.
- Clear: Clears chart data.
- Fit: Adjusts the range to fit the chart to the current view.
- Samples: Sets the buffer size to store data. A value of 0 means all data is stored in the buffer for available memory (the chart does not pan). Any other value controls the size of the window that pans the chart by the buffer size.
Modbus Server
Modbus Server or Slave can be used to learn the Modbus Protocol for beginners and simulate real-world devices for advanced developers needing milliseconds responses to fine-tune the system. The Modbus Server can be started simultaneously on both interfaces (TCP and Serial). This feature allows users to easily simulate Modbus devices for SCADA development without needing physical hardware. The Modbus Server supports multiple servers with a user-friendly Modbus Map, simplifying the setup process. Users can specify the Data Type and Modbus Address, and the application handles the rest. The Modbus Monitor XPF has additional functionality to automatically build a Modbus Map based on client requests (Capture) and simulate real-world sensors by changing values (Simulate). The Modbus Server mode also offers script-based initialization and automation, ensuring efficient and streamlined operations. All Modbus Map and Configuration data can be saved in a standard CSV format for easy documentation and sharing.
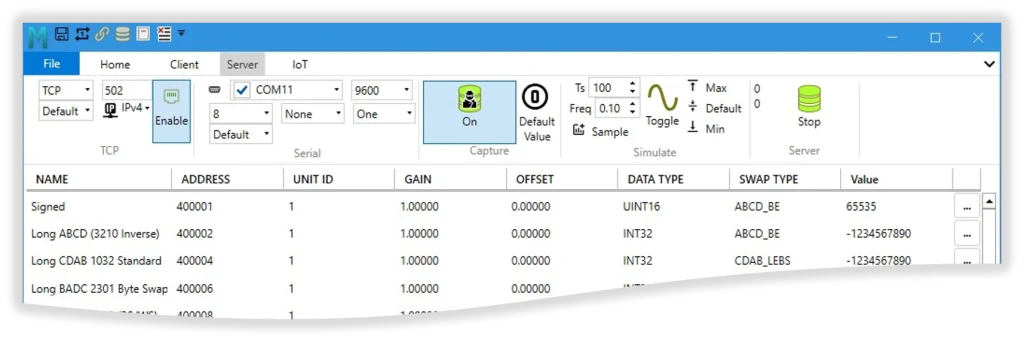
Multiple Servers, Multiple Interfaces
One of the key strengths of the Modbus Monitor XPF application is its ability to run multiple servers with two physical interfaces simultaneously. The picture above shows how the TCP and Serial sections are ready for configuration. The TCP server can run concurrently with multiple Serial Ports. For example, the image shows the Modbus TCP server running on Port 502 along with Modbus RTU on COM10, COM11, and COM12, each with its baud rate settings.
Modbus TCP Server Selection
| Interface | To Interface Types are available for Modbus Server: > TCP: Modbus TCP server is started on the port when enabled > UDP: Modbus UDP server is started on the port when enabled |
| Protocol Options | Six Modbus Protocols available for the Server: >Default: Modbus TCP or Modbus UDP (selected by the interface) >RTU: Enable Modbus RTU over TCP or Modbus RTU over UDP >ASCII: Enable Modbus ASCII over TCP or Modbus ASCII over UDP Six Modbus varieties are available for Server Mode based on the combination of the Interface and Protocol Options. |
| Server Port | Port number for Modbus Server. Default Port 502 |
| Server IP | IPv4: Create a server on the IPv4 address range. IPv6: Create a server in the IPv6 address range. Both: Create a Server that supports IPv4 and IPv6 address scheme Loopback: Enable checkmark to use the local loopback address automatically. For example, “127.0.0.1” or “localhost” for IPv4 Scheme and “::1” for IPv6 loopback addresses. Uncheck to specify your address. |
| Enable | Enable: Start Modbus TCP or UDP server. Disable: Don’t start on TCP or UDP interfaces |
Multiple Servers, Single Interface
It is common practice to run multiple instances of the server on the same interface, such as TCP, by running multiple instances of the Modbus Monitor XPF application, each with different TCP port numbers. For instance, you can run Modbus TCP on Port 502 and Modbus RTU over TCP on Port 602.
Modbus RTU Server Selection
| COM Port | Select the COM Port to run the Modbus RTU Server on. Note: Multiple COM Ports are supported, each with different communication settings. To enable all COM ports that needs a server. |
| Communications Parameters | Select Baud rate, Data Bits, Parity, and Stop bits for the server. |
| Protocol | Default: Start Modbus RTU server on selected COM Port RTU: Same as default. ASCII: Modbus ASCII server on selected COM Port |
Capture – Modbus Map Traffic Sniffer
Effortlessly sniff Modbus Map traffic from connected clients and automatically build Modbus Maps. This feature is invaluable when Modbus Maps are unknown or unavailable from manufacturers, providing a way to discover the addresses the Modbus Master is using.
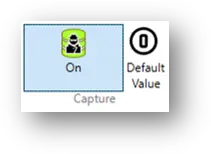
- On: Enable the addition of Modbus Monitoring points based on Modbus Requests. Note that the server must be running for this feature to work.
- Off: Disable the Capture or Modbus Traffic sniffer.
- Default Value 0:Fill “0” as the value into the newly created Modbus Map;
- Auto Value: or use the Modbus Register address as the fill value.
Server (Start/Stop)
Both the Modbus TCP server (when Enabled) and Modbus RTU server start simultaneously (when the COM port is selected).